In this article, we will understand the concept of Probabilistic Graphical models, their components and their applications. We can define the Probabilistic Graphical models as Probabilistic means the nature of problems that we are generally interested in solving or the type of queries that we all make are all probabilistic in nature because of uncertainty. We use probability theory to solve these types of problems. The graphical model means graphical representation helps us to visualize better. So, we use Graph theory to reduce the number of relevant combinations of all the participating variables to represent high dimensional probability distribution model more compactly. And, Models are the representation of a real-world scenario that we want to analyze. It is represented by using a mathematical tool such as a graph or an equation. So, Probabilistic Graphical Models are techniques of compactly representing a joint distribution by exploiting dependencies between random variables. Here, joint distribution describes how two or more variables are distributed simultaneously and it is useful in inference or decision-making stage.
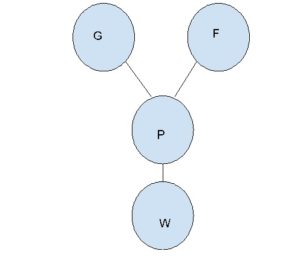
To get a probability from the joint distribution of A and B, we would consider P (A=a and B=b). Probabilistic Graphical Models are used to create models of complex real-world scenarios and represent them in a compact graphical representation. In other words, they are a general framework that builds ideas from statistics and probability theory. They represent probability distributions in a way that the distributions can be encoded in conditional independent structure and enable graph algorithms for decision making and learning. They belong to the family of the Generative model in Machine Learning. Probabilistic Graphical Models are useful because we can just simply look at the graph and determine joint distribution as joint distribution is helpful in inferencing and we can also determine conditional dependency i.e if one variable is independent of another by simply looking at the graph. Let us consider an example of a cricket player landing a spot in the 2019 World Cup squad. We have four binary variables as in only two possible outcomes which is Yes or No is possible. So, the four binary variables are –
- A spot in the World Cup (Assume it as W)
- Performance in the Pre- World Cup tour (Assume it as P)
- Good Genetics (Assume it as G)
- Good form (Assume it as F)
This will work as first of all we have a spot that is offered to a player in the World Cup team. But, what is the process to give the spot to the player? Well, the spot can be given on the basis of performance in the tours that precede the World Cup and his form. Even, if the player has an awesome career record, but if he performs poorly in the year prior to the World Cup then, probably he is going to be cut off from the team. So, how does one get to these trials? It mostly depends on two things –
- Good Genetics
- Good Form
So, this is the part of the example where we intuitively know how this works that means it has something to do with the good genetics and good form and there is another part of the example that shows how it formally works which means it depends on the player’s performance in Pre-World Cup tours. The cricket board will always tell the players that we are going to look at the performance of the player in the tours that preceded the World Cup. Following is the graph of this scenario-

There are two components of probabilistic graphical models. They are –
- Nodes-
The circles with variable names in them represent nodes. They are called random variables.
- Edges-
The lines connecting various nodes are called edges. They are called as internodal dependencies.
Probabilistic Graphical Models work in three ways –
- First of all, we assume that a given data has a probability distribution.
- Then, we estimate the parameter of the distribution
- At last, we find the unknown variables using the known variables.
For example, there is a picture containing different objects like bus, car, tree, etc. At first, we distribute them according to their pixels. It will be difficult for the machine to remember each pixel. So, we label them and with these labels, we inference the objects.
There are also different applications of the Probabilistic Graphical Model. They are –
- They are used in medical and fault diagnosis.
- They are used in natural language processing and traffic analysis.
- They are also used in computer vision for image segmentation, 3D reconstruction and holistic scene analysis.
Suggested Course : Machine Learning
Improve your career by taking our machine learning courses.
